
.

| COURSEWORK QUESTION PAPER: 1st sit | Autumn 2022 Semester |
| Module Code: | FE4060NI |
| Module Title: | Understanding and Managing Data |
| Module Leader: | Bigendra Lal Shrestha (Islington College) |
| Coursework Type: | Individual coursework 1: Quantitative analysis and Report based on a set of tasks and business objectives. You must have the Excel file to perform the data analysis task. “FE4060NI Understanding and Managing Data A22 (Re Sit) – CW PRE” |
| Coursework Weight: | This coursework accounts for 100% of your total module grades. |
| Submission Date: | TBA |
| When Coursework is given out: | TBA |
| Submission Instructions: | There are a set of tasks that you need to complete for the coursework. Once completed, you are required to compile all the tasks and develop a 1 single file Submit the following to the RTE department before the due date:1 Final Report in PDF Format1 Excel File |
| Warning: | London Metropolitan University and Islington College take Plagiarism seriously. Offenders will be dealt with sternly. |
© London Metropolitan University
Individual coursework 1:


Quantitative analysis and Report based on a set of tasks and business objectives. (100 marks)
PLEASE READ THE FOLLOWING CAREFULLY
Section A: Learning outcomes of the assessment
Learning Outcome(s) addressed by this assessment:
- Appreciate the role of quantitative methods for business analysis, planning and performance measurement;
- Use Excel facilities to transform data into information to facilitate problem-solving and business decision-making;
- Demonstrate an understanding of basic statistics and modelling techniques and be able to interpret and communicate findings.
Section B: Introduction
The module has one summative assessment consisting of two parts.
- The first part requires students to complete, and provide a 400-word commentary on, a set of short tasks. These tasks can cover a range of concepts, methods and models across a variety of business and management settings.
- The second part is course-specific: the context, data set and decision problem will reflect the students’ subject area. This part requires students to select appropriate data analysis and/or modelling techniques to analyse a specific business problem. It involves the preparation of a 600-word report to interpret the findings and to communicate recommendations to decision-makers.
Both parts require the use of Microsoft Excel to summarise and analyse the data and Microsoft Word to report the findings and recommendations.
Section C: Assessment Strategy
Coursework 1 consists of 2 parts. All tasks in both parts need to be attempted
Part A:
Task 1: Ungrouped Descriptive Statistics [10 marks]
To gain some insights into the typical price consumers are willing to pay for a stand mixer, a retailer of kitchen appliances randomly selected 130 relevant invoices for transactions completed in October 2020. Descriptive statistics, computed to summarise the data, are presented in Table 1 below.
NB: Some values are missing. This table has been made available in the Excel file named ” FE4060NI Understanding and Managing Data A22 (Re Sit) – CW PRE” under the tab labelled Task 1.
Table 1 – Ungrouped Descriptive Statistics
| Expenditure (£) on Stand Mixers | |
| Mean | |
| Standard Error | 6.58 |
| Median | 224.00 |
| Mode | 224.00 |
| Standard Deviation | |
| Sample Variance | 5625.09 |
| Kurtosis | -0.49 |
| Skewness | -0.32 |
| Range | 301.00 |
| Minimum | 68.00 |
| Maximum | 369.00 |
| Sum | 29120.00 |
| Count | |
| Coefficient of Variation | 33.5% |
Required for Task 1 (Comments for task 1 should not exceed 50 words in total.)
- With reference to Table 1 above and using a calculator, find the mean and standard deviation.
Insert your values on the table and copy them into your Word document.
- Interpret the mean and standard deviation in the context of the scenario provided.
NB: You should not describe calculation methods.
Task 02: Grouped Descriptive Statistics [15 marks]
It was suggested to the retailer that the 130 transaction values could also be summarised in a grouped table (see Table 2 below). Three table templates based on Table 2 have been made available in the Excel file named “FE4060 Autumn CWK 1 Data” under the tab labelled Task 2.
Required for Task 02 (Comments for task 2 should not exceed 100 words in total.)
Table 2 – Grouped Descriptive Statistics
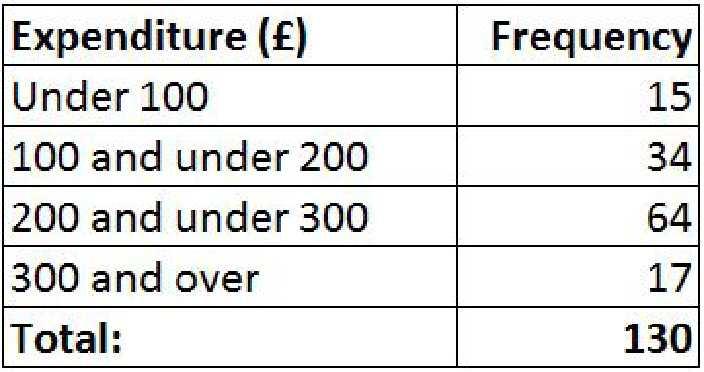
Required for Task 2 (Comments for task 2 should not exceed 50 words in total.)
- Using the three table templates provided in the Excel data file as a starting point, construct three tables in Excel. The first table should show the frequencies and percentage frequencies. The second table should show the ‘less than’ cumulative frequencies and cumulative percentage frequencies. Complete the third table to estimate the mean and standard deviation. You need to copy the Excel output (3 tables) into your Word document.
- Compare the grouped data mean and standard deviation values to the ungrouped data mean and standard deviation calculated under task 1. Why are the values different and which findings being more accurate; the ungrouped or grouped statistics? Justify your answer.
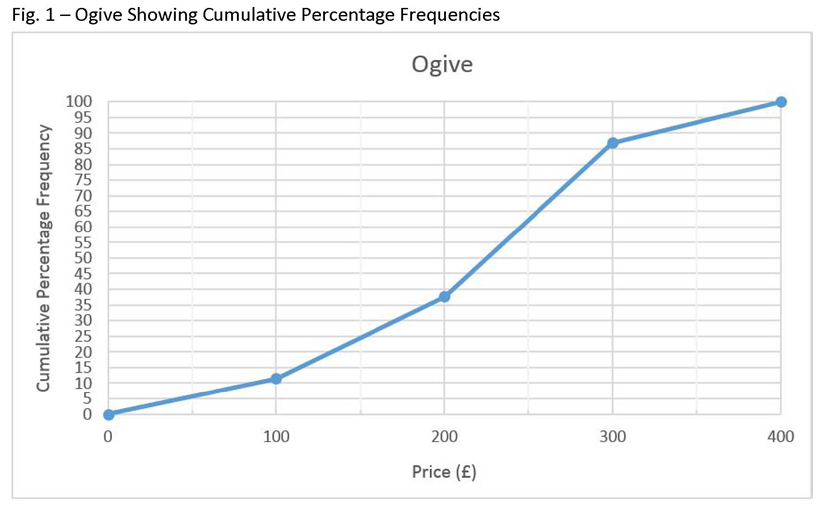
- With reference to fig. 1 below (ogive), comment on the estimated minimum amount a consumer needs to spend on a stand mixer to belong to the top 25% in terms of expenditure.
Task 3: Data Types [15 marks]
The kitchen appliances retailer seeks to survey its customers to gain insights into key consumer characteristics, including demographic profiles and lifestyle preferences. It is believed this will help the company better understand its target consumers and strengthen its position in the market. However, before outsourcing the data collection fieldwork, the retailer seeks clarification on data types, as outlined in the requirements below.
Required for Task 3 (Comments for task 3 should not exceed 100 words in total.)
- With reference to examples relevant to the retailer’s information needs, discuss the differences
between cross-sectional data and time series data and clearly state whether cross-sectional data,
time series data or both types of data should be collected to gain insights into the demographic
profile and lifestyle characteristics of its customers.
Use and credit one source. The citation and reference must be credited using the Harvard method. The reference is excluded from the 100-word limit.
Task 4: Networking [20 marks]
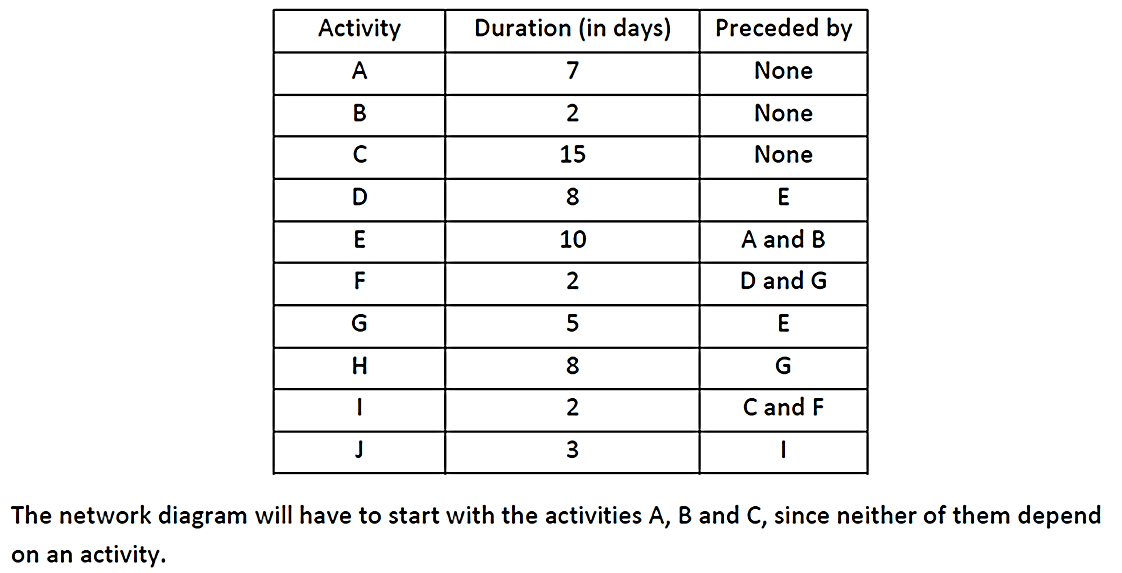
The retailer has seen a shift in the way in which consumers purchase items, such as kitchen appliances. Online retailing now accounts for over 80% of their sales and, to reflect this change, the retailer has decided to convert some of its retail space into warehouse space. This conversion project consists of 10 activities. For example, Activity C takes 3 weeks to complete and can only be started after Activity A has been completed. Information on the 10 activities is outlined in Table 3 below.
Table 3 – Precedence Table
Required for Task 4 (Comments for task 4 should not exceed 50 words in total.)
- With reference to Table 3, construct a network diagram by going through the forward and backward passes. You may draw your network diagram in Excel or Word. The network diagram needs to be copied into your Word file.
- Identify the critical path and duration of the project.
- Comment on the distinction between critical and non-critical activities.
Task 5: Relationships [12 marks]
To operate more effectively, the retailer wants to better understand the relationship between sales revenue, total costs, average order value and gross profit. To this end, data for the period 2014, quarter 1 to 2020, quarter 3 were made available. To complete task 5, refer to the data provided under the tab named “Task 5” in the “ FE4060NI Understanding and Managing Data A22 (Re Sit) – CW PRE” Excel file.
Required for Task 5 (Comments for task 5 should not exceed 150 words in total.)
- Construct a correlation matrix in Excel to show the correlation coefficients between quarterly Sales Revenue (£’000) and total costs (£’000), average order value (£) and gross profit (£’000).
The correlation matrix needs to be copied into your Word file. - With reference to the correlation matrix, identify the ‘best’ predictor of quarterly Sales Revenue (£’000) and briefly explain the reason for your choice.
- Create a scatter graph, plotting quarterly Sales Revenue (£’000) against the independent variable selected under point 2 above. The trend, regression equation and coefficient of determination should be shown on the graph. Copy the correctly labelled graph, with the correct units of measurement, into your Word file.
- Interpret the relevant correlation coefficient and the coefficient of determination in context.
- State the regression equation in context and interpret the values of the intercept and gradient in
the context of the scenario.
Task 6: Expected Values [8 marks]
The retailer has the option to invest in either venture A or venture B. Both ventures require an investment of £40,000.
The net expected values and standard deviations for the two ventures are stated in Table 4 below.
Table 4 – Outcomes
| Venture A | Net EV = £48.0 | Standard Deviation = £31.08 |
| Venture B | Net EV = £42.2 | Standard Deviation = £14.32 |
Required for Task 6 (Comments for task 6 should not exceed 50 words in total.)
- Calculate the coefficients of variation for venture A and venture B.
Assuming the retailer is risk averse, which project should be chosen?
Task 07: Break Even Analysis (10 marks)
A group of Year 1 students decided to set up a stall to sell soft drinks at the Spring Carnival 2022. The students decided to buy the drinks from a wholesale supplier at Rs 30 per bottle. They decided to sell them at Rs 65 per bottle.
Unfortunately, they had to rent the stall from the college and they had to pay Rs.2000 for just one day. But the manager of the event told them that the likely volume they would be able to sell is 200 bottles which would give them a good profit.
Required:
- Identify the different cost classifications that the students will incur in the given case for the purpose of Cost-Volume-Profit analysis. Explain the reason.
- How many drinks will the students have to sell to break even? Show the calculation and round up your answer to a whole number.
- Build a Break-even chart to help students understand why they need to sell more than break-even quantity to earn profit.
- Considering the students will be able to sell 200 bottles of drink, calculate:
- Profit in Rupees
- Margin of safety in percentage.
- While planning for the day, a student realizes that they will require a fridge to keep the drinks cold as it would be a hot day. After the inquiry, they find out that hiring fridge will cost them the rental expense of Rs 1,000. Discuss what impact this cost will have in the break-even point and the profit with the evidence.
- Under what circumstances, the above Cost-Volume-Profit analysis may not be suitable to the case in the discussion? Explain.
Guidelines and Instructions – All Tasks
- This individual coursework consists of two parts. Part 1 consists of seven tasks. Part 2 comprises a substantial task that involves the preparation of a 400-word report. You must attempt and complete all tasks in parts 1 and part 2.
- For part 1: task 1, task 2 and task 5 you need to download the “ FE4060NI Understanding and Managing Data A22 (Re Sit) – CW PRE” Excel.
- To complete tasks 1, 2, 4, 6 and part 2, refer to fig. 1 on page 2 and tables 1, 3, 4 and 5 on pages 1, 3, 4 and 6 of these briefs. An Excel data set is not provided for part 1: tasks 3, 4 and 6. Task 7 requires a short reflective commentary evaluating personal learning and development. An Excel data set is not provided for part 2.
Tasks need to be clearly labelled in your submission. Each task should start on a fresh page. Tables
and graphs must be numbered and titled. Calculation methods should not be described:
comment on the meaning or significance of the calculated values only.
- For part 1, task 1, you need to calculate the 2 missing values (mean and standard deviation) using
a calculator. The values must be inserted into the table found under the tab labelled Task 1. The completed table must be copied into the Word document. Short comments need to be provided
on the findings.
For part 1, task 2, you need to complete three tables in Excel. The first should show the
frequencies and percentage frequencies. The second should show the ‘max in class’, cumulative
frequencies and percentage cumulative frequencies. The third should be prepared to find the
mean and standard deviation. Short comments need to be provided under points 2 and 3.
For part 1, task 3, you need to discuss the various concepts, provide examples and justify your
recommendation. One reference needs to be provided for task 3. The source needs to be cited in
the text and listed in a bibliography. The Harvard referencing style must be used.
Part 1, task 4 requires the construction of a network diagram to reveal the project’s critical path
and duration. The difference between critical and non-critical activities should be discussed.
For part 1, task 5, you need to use an appropriate Excel function to create a correlation matrix to
show the relationship coefficients between all relevant variables. The best predictor of the
quarterly Sales Revenue (£’000) is identified and the reason for its selection is justified. A titled,
well-labelled scatter graph, with the trend, regression equation and coefficient of determination,
is presented. The regression equation is stated in context (i.e., using variable names rather than
x and y). The relationship and the various coefficients are explained in context.
Part 1, Task 6 requires the evaluation of expected returns and relative risk. The least risky project
should be identified.
Part 1, Task 7 requires a short, reflective commentary, written in a first-person narrative.
Part 2 requires the preparation of a 400-word report to advise management on procedures, costs,
breakeven and target quantities and safety margins
Required Excel output, i.e., tables and graphs, needs to be copied into your Word document and
presented alongside the comments and/or report.
- Comment on the facts only: avoid speculations and generalisations. Comments must be
supported by the evidence and show units of measurement, where appropriate.
- Adopt a formal, professional language (third person, impersonal) for part 1, tasks 1 through 6 and
for the report of part 2. This means you should avoid the use of ‘I’, ‘you’, ‘we’, ‘my’, etc. The
personal reflection (part 1, task 7) should be written in the first-person perspective.
- The word limit for this coursework is 1000 words in total: 600 words for part 1 and 400 words
for part 2.
- Interpretations should be written in your own words. Work copied directly from lecture notes, or
other sources will have marks deducted and/or will be referred (also see point 7 below).
- This is an individual assignment. Where Academic Misconduct, such as collusion, plagiarism or
cheating is suspected, your coursework mark will be reduced proportionately to the extent of the
misconduct identified, however, more severe penalties are possible. Cases are referred to the
Casework Office and substantiated Academic Misconduct will be recorded on the student’s
record. To avoid misunderstanding, please familiarise yourself with Section 15 of the Academic
Regulations covering Academic Misconduct Regulations and Procedure.
- All output must be saved as a single Word file and uploaded to VLE. A single PDF can be accepted as an alternative. Your first submission to RTE is final. Instructions on how to submit work will be provided closer to the submission deadline date. The submitted coursework should include a cover page with your student number. You are advised to keep a copy of all work submitted.
Section C – Reflective Learning (10 Marks)
Task 08: Personal Learning
This task requires reflection to provide insights into the process and quality of personal learning. Your reflection should focus on your actions, motivations and emotions and should analyse what changes will be made to practice in light of experiences, feedback and reflection. A good reflection will help you understand what, why and how you learn.
Note You should not comment on the theories of reflection. You should also not evaluate teaching or the module for this exercise.
Section D: Assessment submission
- The coursework will be due at the date disclosed by the RTE department.
- The submission must contain 1 file in total
- 1 PDF Report for all three parts, combined
- Report must include the provided cover page and a table of contents
- 1 PDF Report for all three parts, combined
- Report Requirements
- Font: Arial, Size 12 (work must be typed)
- Line spacing: 1.5
- Paragraphs must be justified
- Table and graph references with proper title must be developed
- References & Bibliography
- You must reference sources that you use in the body of your answer
- You must include a full bibliography at the end of the written work
- You must use at least 4 valid resources
- You must use the Harvard method
Section E: Marking Criteria: How you will be evaluated?
For all tasks, you are required to correctly calculate relevant statistics, analyse the data and provide
/ demonstrate:
- Clear interpretations of all statistical analyses (do not just state the values but comment on what
the values imply without speculating, where required); - Graphs and tables with informative titles, appropriate labelling and units stated;
- Accurate calculations where required (equations are stated in the context of the data);
- Comments are written in the context of the meaning of the data or analysis;
- Appropriate use of Excel functions, as evidenced by the output.
NB: Unless instructed otherwise, do not describe or explain calculation methods when asked to
interpret or comment on the values.
Coursework marks can range from 0 to 100.
Section F: Recommended Table of contents
Cover page
Table of content
All tasks in the sequence
References
Appendix
Section G: Recommended Reading for references
- Oakshott, L. (2020) Essential Quantitative Methods for Business, Management and Finance. 7th edition. Red Globe Press
- Evans, J.R. (2016) Business Analytics, Global Edition. 2nd edition. Pearson
- Wisniewski, M. and Shafti, F. (2019) Quantitative Analysis for Decision Makers. 7th edition, Blackwells
- HBR (2018) Guide to Data Analytics Basics for Managers. HBR Guide Series. Harvard Business Review Press
- Curwin, J. et al (2013) Quantitative Methods for Business Decisions. 7th edition. Cengage
Section H: Assessment Grade Description
GSBL UNDERGRADUATEGENERAL GRADE DESCRIPTORS
| Level 3/4 | Level 5 | Level 6 | |
| General | Acquisition of broad knowledgeEvaluate informationUse information to plan, develop and problem solve | Generate ideas through analysing conceptsDemonstrate a command of specialised skillsFormulate responses to well defined and abstractAnalyse and evaluate information | Critically review, consolidate and extend a body of knowledge using specialised skillsCritically evaluate concepts and evidence from a range of sourcesTransfer and apply skills and exercise significant judgement in a range of situations |
| 70-100 (A) | Very goodDemonstration of very good comprehension of the task with evidence of analysis, synthesis, evaluation and critical appraisalUse of a wide variety of appropriate sourcesTransformation of knowledgeIndependent thinking and development of ideasAbility to communication very clearly and effectivelyVery good evidence of preparationVery good organisation, structure and presentation of work – minimal errorsGood references, appropriate sources (quality and quantity). No errors in reference list or citations. | ExcellentAdvanced scholarshipGoes beyond the material providedExcellent link to researchExcellent analysis, synthesis, evaluation and critical appraisalExcellent evidence of preparationComprehensive and critical understanding of the topicExcellent ability to communicate clearly and effectivelyExcellent organisation, structure and presentation of workGood references, appropriate sources (quality and quantity). No errors in reference list or citations. | Excellent – Outstanding (for use at far end of range)Outstanding understanding, exploration and insightStrong evidence of originality and development of own ideasDevelop a highly complex argumentOutstanding ability to communicate topics clearly and conciselyAdvanced organisation, structure and presentation of workGood references, appropriate sources (quality and quantity). No errors in reference list or citations.References well utilised and critiqued |
| 60-69 (B) | Very goodDemonstration of very good comprehension of the task with evidence of analysis, synthesis, evaluationUse of a wide variety of appropriate sourcesTransformation of knowledgeIndependent thinking and development of ideasAbility to communication clearly and effectivelyVery good evidence of preparationVery good organisation, structure and presentation of work – minimal errorsGood references, appropriate sources (quality and quantity). Minimal or no errors in reference list or citations. | Very goodDemonstration of very good comprehension of the task with evidence of analysis, synthesis, evaluationUse of a wide variety of appropriate sourcesTransformation of knowledgeIndependent thinking and development of ideasAbility to communication clearly and effectivelyVery good evidence of preparationVery good organisation, structure and presentation of work – minimal errorsGood references, appropriate sources (quality and quantity). Minimal or no errors in reference list or citations. | Very GoodAdvanced scholarshipGoes beyond the material providedVery good link to researchVery good analysis, synthesis, evaluation and critical appraisalVery good evidence of preparationComprehensive and critical understanding of the topicVery good ability to communicate clearly and effectivelyVery good organisation, structure and presentation of workGood references, appropriate sources (quality and quantity). No errors in reference list or citations. |
| 50-59 (C) | Adequate – SatisfactorySome analysis but limitedSome insight and exploration of ideasSound conclusionsNo significant inaccuracies or omissionsSome analysis, evaluation or synthesis of informationLacking clarity at timesSome evidence of preparationReferencing is sound. Mostly appropriate sources. Numerous errors or inconsistencies | Adequate – SatisfactorySome evidence of thinking independently to develop own ideasEvaluation of relevant theories or literatureReasonable ability to communicate clearly and effectivelyReport information in a structured wayUse of an appropriate formatQuite comprehensive knowledgeSatisfactory evidence of preparationSatisfactory referencing, appropriate sources.Numerous but minor errors in references | Adequate- SatisfactoryEvidence of thinking independently to develop own ideasEvaluation of relevant theories or literatureAbility to communicate clearly and effectivelyReport information in a structured wayUse of an appropriate formatReasonably Accurate, quite comprehensive knowledgeSatisfactory evidence of preparationCoherent and well presented – minor errorsSatisfactory referencing, appropriate sources.Minor errors in references |
| 40-49 (D) | All learning outcomes metCompetent (practical)May be incomplete in knowledge (some errors or omissions)Insufficient analysis, evaluation or synthesisLimited application of theories/knowledgeAn awareness of appropriate principles/theories/techniquesIrrelevance to the task at timesDisorganised work with weak standard of presentationNumerous aberrations from the requirements of the taskReferencing is attempted although may be inconsistent, many errors, weak sources | All learning outcomes metCompetent (practical)May be incomplete in knowledge (some errors or omissions)Weak or no analysis, evaluation or synthesisSome application of theories/knowledgeAn awareness of appropriate principles/theories/techniquesIrrelevance to the task at timesDisorganised work with weak standard of presentationAberrations from the requirements of the taskReferencing is attempted although may be inconsistent, many errors, weak sources | All learning outcomes metCompetent (practical)May be incomplete in knowledge (some errors or omissions)Weak or no analysis, evaluation or synthesisSome application of theories/knowledgeAn awareness of appropriate principles/theories/techniquesIrrelevance to the task at timesDisorganised work with weak standard of presentationAberrations from the requirements of the taskReferencing is attempted although may be inconsistent, many errors, weak sources |
| Condoned Pass 30-39 (R2/F1) | Learning outcomes not metLittle relevant knowledgeLacking structureNumerous errors in structure and formLimited understanding of concepts/theoriesNo appropriate analysis, evaluation or synthesisSignificant inaccuracies/omissionsNot competentLittle or no attempt to use references and if so very weak with errors | Learning outcomes not metLittle relevant knowledgeLacking structureNumerous errors in structure and formLimited understanding of concepts/theoriesNo appropriate analysis, evaluation or synthesisSignificant inaccuracies/omissionsNot competentLittle or no attempt to use references and if so very weak with errors | Learning outcomes not metLittle relevant knowledgeLacking structureNumerous errors in structure and formLimited understanding of concepts/theoriesNo appropriate analysis, evaluation or synthesisSignificant inaccuracies/omissionsNot competentLittle or no attempt to use references and if so very weak with errors |
| Under 30 (R2/F2) | Little engagement with the taskNo basic understanding of the subject matterPoor communication (written or verbal)Lacking or no structureSignificant errors in structure and formMany significant inaccuracies/omissions – very little correctLittle or no attempt to use references and if so very weak with many significant errors | Little engagement with the taskNo basic understanding of the subject matterPoor communication (written or verbal)Lacking or no structureSignificant errors in structure and formMany significant inaccuracies/omissions – very little correctLittle or no attempt to use references and if so very weak with many significant errors | Little engagement with the taskNo basic understanding of the subject matterPoor communication (written or verbal)Lacking or no structureSignificant errors in structure and formMany significant inaccuracies/omissions – very little correctLittle or no attempt to use references and if so very weak with many significant errors |
| (0%) | No submissionNothing of relevance in the work submitted | No submissionNothing of relevance in the work submitted | No submissionNothing of relevance in the work submitted |
– End of Document


 – Project and Professionalism – FYP")
")


e65azo
Your article helped me a lot, is there any more related content? Thanks!
clomiphene generic get clomiphene online where can i get cheap clomid cheapest clomid pills clomiphene prescription cost clomid pregnancy where buy generic clomiphene
This is a theme which is forthcoming to my callousness… Numberless thanks! Unerringly where can I upon the phone details in the course of questions?
I’ll certainly carry back to skim more.
Your article helped me a lot, is there any more related content? Thanks!
azithromycin 500mg for sale – buy ciplox 500mg online flagyl order
buy semaglutide 14 mg generic – semaglutide drug buy periactin pills for sale
domperidone 10mg over the counter – sumycin 250mg ca buy cyclobenzaprine
order inderal 10mg pills – where to buy plavix without a prescription methotrexate 2.5mg oral
amoxil price – amoxil pills brand combivent
buy generic zithromax 500mg – cost tindamax nebivolol 20mg sale
clavulanate over the counter – atbioinfo buy ampicillin medication
how to get nexium without a prescription – https://anexamate.com/ esomeprazole 40mg pills
purchase warfarin sale – coumamide.com losartan tablet
meloxicam 7.5mg without prescription – swelling meloxicam 15mg tablet
prednisone drug – arthritis buy deltasone 10mg for sale
buy ed pills no prescription – https://fastedtotake.com/ buy cheap ed pills
buy generic amoxicillin – amoxicillin tablets cheap amoxicillin
Your article helped me a lot, is there any more related content? Thanks!
buy diflucan 100mg pills – purchase forcan order forcan generic
lexapro 10mg brand – buy escitalopram pills for sale order generic escitalopram
order cenforce 100mg generic – cenforce rs cenforce 50mg us
when is generic cialis available – on this site how well does cialis work
buy zantac 300mg online cheap – ranitidine 150mg drug buy ranitidine pills
viagra sildenafil 50mg tablets – https://strongvpls.com/# cheapest viagra 50mg
More posts like this would prosper the blogosphere more useful. buy lasix generic
I couldn’t weather commenting. Profoundly written! on this site
More delight pieces like this would urge the web better. https://ursxdol.com/azithromycin-pill-online/
This is the kind of glad I have reading. https://prohnrg.com/product/rosuvastatin-for-sale/
Thank you for your sharing. I am worried that I lack creative ideas. It is your article that makes me full of hope. Thank you. But, I have a question, can you help me?
This is the stripe of content I enjoy reading. https://aranitidine.com/fr/en_france_xenical/
Thanks for sharing. I read many of your blog posts, cool, your blog is very good.
Thanks on putting this up. It’s okay done. https://ondactone.com/product/domperidone/
I couldn’t turn down commenting. Profoundly written!
buy colchicine medication
Thank you for your sharing. I am worried that I lack creative ideas. It is your article that makes me full of hope. Thank you. But, I have a question, can you help me? https://www.binance.info/pt-BR/register-person?ref=YY80CKRN
Your article helped me a lot, is there any more related content? Thanks! https://www.binance.com/en-IN/register?ref=UM6SMJM3
order dapagliflozin 10 mg generic – https://janozin.com/# buy forxiga 10 mg pills
orlistat cost – https://asacostat.com/ buy xenical 60mg for sale
I am in point of fact thrilled to gleam at this blog posts which consists of tons of useful facts, thanks representing providing such data. http://furiouslyeclectic.com/forum/member.php?action=profile&uid=24854
Your article helped me a lot, is there any more related content? Thanks!
Your article helped me a lot, is there any more related content? Thanks! https://accounts.binance.info/zh-CN/register-person?ref=WFZUU6SI
Can you be more specific about the content of your article? After reading it, I still have some doubts. Hope you can help me.
I don’t think the title of your article matches the content lol. Just kidding, mainly because I had some doubts after reading the article.
Your article helped me a lot, is there any more related content? Thanks!
Une pharmacie oГ№ professionnalisme rime avec humanitГ© – https://www.keskeces.com/pharmacie-de-garde/58470-magny-cours.html , Pharmacie proche de vous, prГЄte Г rГ©pondre Г tous vos besoins de santГ© .
I don’t think the title of your article matches the content lol. Just kidding, mainly because I had some doubts after reading the article. https://accounts.binance.info/register-person?ref=JW3W4Y3A
Thank you for your sharing. I am worried that I lack creative ideas. It is your article that makes me full of hope. Thank you. But, I have a question, can you help me?
Your article helped me a lot, is there any more related content? Thanks! https://accounts.binance.com/fr/register-person?ref=T7KCZASX
Thank you for your sharing. I am worried that I lack creative ideas. It is your article that makes me full of hope. Thank you. But, I have a question, can you help me? https://www.binance.bh/futures/ref?code=W49FLGDN
Can you be more specific about the content of your article? After reading it, I still have some doubts. Hope you can help me.
Can you be more specific about the content of your article? After reading it, I still have some doubts. Hope you can help me.
Your point of view caught my eye and was very interesting. Thanks. I have a question for you.
I don’t think the title of your article matches the content lol. Just kidding, mainly because I had some doubts after reading the article.